




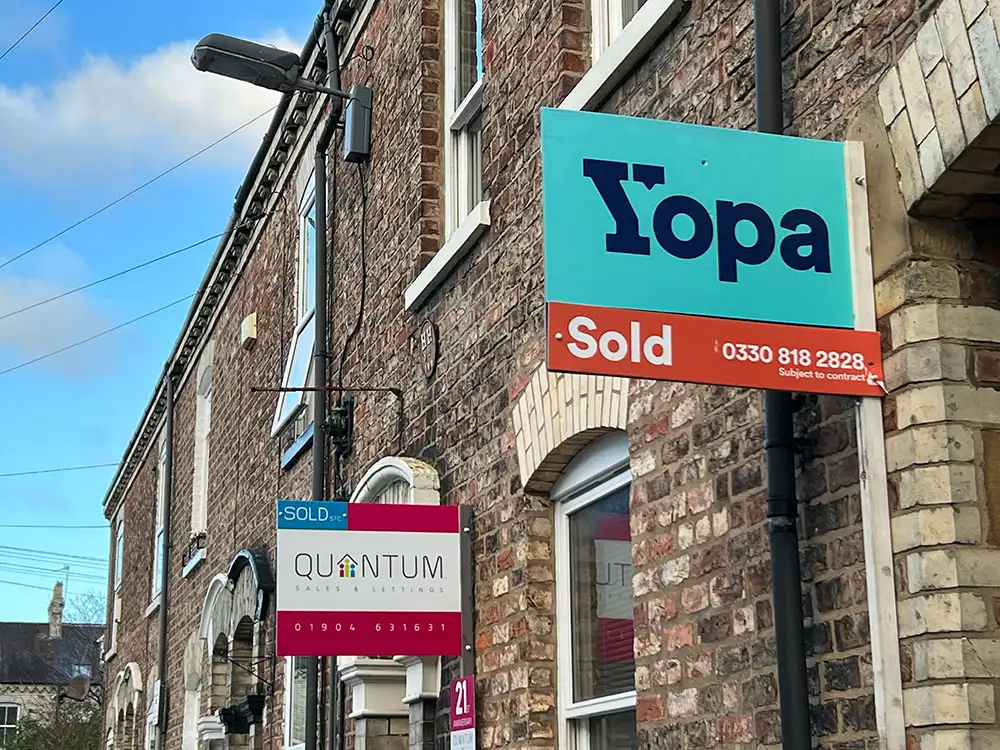

People selling their homes in York are knocking thousands off the price, new research reveals.
But the amount of the discount depends on the postcode in and around the city.
Research by property website Property Solvers shows the change in house prices in the YO postcodes between September 2025 and September 2026.
This showed that the biggest price drops between asking price and selling price were for these postcodes:
- YO60 (Sheriff Hutton): -£17,800
- YO10 (Fishergate / Fulford): -£14,438
- YO19 (Dunnington / Escrick): -£13,547
- YO62 (Helmsley / Kirkbymoorside): -£13,502
Largest house price drops in the York (YO) postcode
| Postcode (Area) | Avg. Asking Price | Avg. Sold Price | Avg. Price Difference | Avg. Price % | No. of Properties |
|---|---|---|---|---|---|
| YO60 (York) | £473,200 | £455,400 | -£17,800 | -3.91% | 14 |
| YO10 (York) | £355,195 | £340,757 | -£14,438 | -4.24% | 108 |
| YO19 (York) | £439,681 | £426,134 | -£13,547 | -3.18% | 82 |
| YO62 (York) | £377,229 | £363,727 | -£13,502 | -3.71% | 77 |
| YO13 (Scarborough) | £354,021 | £340,616 | -£13,405 | -3.94% | 66 |
| YO21 (Whitby) | £308,914 | £295,517 | -£13,397 | -4.53% | 90 |
| YO18 (Pickering) | £323,958 | £311,103 | -£12,855 | -4.13% | 93 |
| YO22 (Whitby) | £321,065 | £308,226 | -£12,839 | -4.17% | 52 |
| YO23 (York) | £416,337 | £404,048 | -£12,289 | -3.04% | 153 |
| YO41 (York) | £367,865 | £355,960 | -£11,905 | -3.34% | 81 |
- Largest house price drops (between September 2025 and September 2026) in the York (YO) postcode, Source: Property Solvers
Over the same period, the lowest hits on price were seen in YO43 (Market Weighton), where 134 home sellers reduced their properties by an average of -£6,850 (or -2.76%) to get the sale going.
Smallest house price drops in the York (YO) postcode
| Postcode (Area) | Avg. Asking Price | Avg. Sold Price | Avg. Price Difference | Avg. Price % | No. of Properties |
|---|---|---|---|---|---|
| YO43 (York) | £255,302 | £248,452 | -£6,850 | -2.76% | 134 |
| YO16 (Bridlington) | £203,715 | £196,422 | -£7,293 | -3.71% | 239 |
| YO12 (Scarborough) | £221,503 | £214,065 | -£7,438 | -3.47% | 271 |
| YO11 (Scarborough) | £217,691 | £209,998 | -£7,693 | -3.66% | 162 |
| YO25 (Driffield) | £261,889 | £254,077 | -£7,812 | -3.07% | 258 |
| YO8 (Selby) | £286,850 | £277,862 | -£8,988 | -3.23% | 318 |
| YO32 (York) | £358,675 | £349,630 | -£9,045 | -2.59% | 157 |
| YO15 (Bridlington) | £225,112 | £215,970 | -£9,142 | -4.23% | 117 |
| YO14 (Filey) | £237,358 | £228,120 | -£9,238 | -4.05% | 115 |
| YO17 (Malton) | £308,413 | £298,883 | -£9,530 | -3.19% | 152 |
- Smallest house price drops (between September 2025 and September 2026) in the York (YO) postcode, Source: Property Solvers
Ruban Selvanayagam, co-director of Property Solvers, comments: “Although market conditions remain challenging, well-priced homes continue to sell across the country.
“Buyers are simply more discerning than they were a few years ago and have become much more conscious of value.
“The gap between asking and achieved prices often reflects sellers testing the market rather than where buyers are actually prepared to transact.
“Looking at genuinely completed sale prices alongside current asking pricesprovides a far clearer picture of local market conditions.”
They found the price drops by tracking 3,954 property transactions between September 2025 and September 2026.
The figures show the average differences between asking prices on the UK’s leading property websites and their actual sold prices lodged at the HM Land Registry.
You can check any postcode via the asking vs. sold house prices tool on the Property Solvers website here.